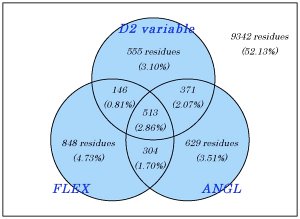
(1) Overlap among three variable
regions (the D2 variable, the FLEX, and
the ANGL regions):
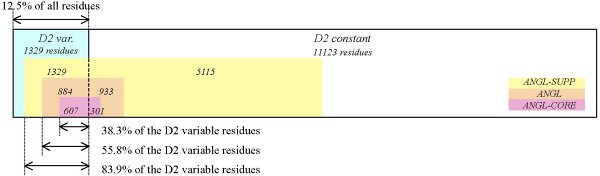
(2) Overlap between the D2/PB/DSSP variable region and each of the three ANGL-type regions:
[NOTE] The figures below shows the ratio of sums, i.e., {Sum of A(i)}/{Sum of B(i)}.
Not the raio of the average of A(i)/B(i). (Added on 2014-12-09)
For reference (Overlap between the FLEX region and each of the three ANGL-type regions):
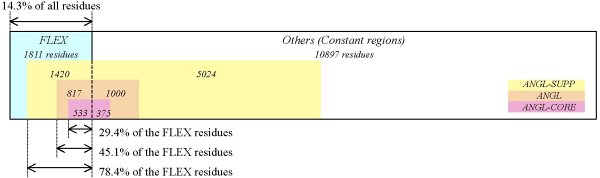
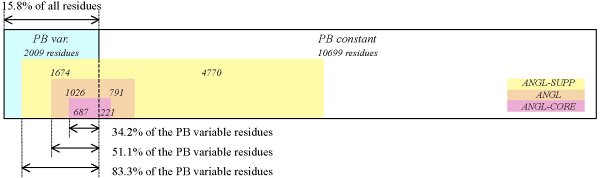
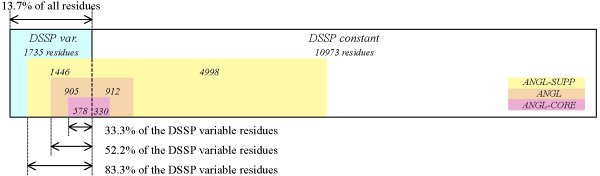