[HOME]

3D SHape REtrieval Contest '10 - Protein Classification Track


We have participated in the SHREC'10 Protein Classification Track.

"The task of this track is to evaluate how well 3D based algorithms can classify protein chains according to the CATH classification. Participating groups will be provided with only the 3D coordinates of the protein atoms and cannot use any prior chemical and biological knowledge of the proteins. The groups will be able to use their algorithms on a training data set of 1000 proteins provided by us. A couple of days before the deadline for the tracks, a list of 50 protein queries will be available for download. The task for each participating group will then be to calculate a ranked list for each of the protein queries against the provided data set. We will then collect the results and calculate the perfomance of each method, using the nearest neighbour and AUC (Area Under the Curve) metrics."
(
From SHREC'10 Protein Classification Track Home Page)


References
  1. SHREC'10 Protein Classification Track Home Page. http://www.loria.fr/~mavridis/SHREC_10/
  2. SHREC Home Page: http://www.aimatshape.net/event/SHREC
  3. 3rd Eurographics Workshop on 3D Object Retrieval homepage : http://www-rech.telecom-lille1.eu/3dor/
  4. CATH homepage : http://www.cathdb.info/


(0) Result

In this section, we present the perfomance evaluation results of the track. Each participating group submitted one set of
results based on their selected set of parameters. This was a blind experiment and each group could only submit one
set of results. Therefore, it was not possible for partipants to tune the parameters of their algorithms.

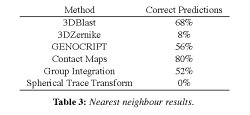
(0.1) Nearest neighbour

jpg image
This table summarizes the retrieval rates for all the methods. There were five cases in which none of the methods found the nearest neighbour. These were: Q12 (1wwjA00), Q30 (1iicA02), Q40 (3c4aA01), Q43 (1nyaA00), and Q48 (3bioA02). In a further seven cases, only one method found the nearest method as the top match.
However, there were 11 additional cases in which several methods found the nearest neighbour as the second hit (i.e. 4 for GENOCRIPT, 3 for Group Integration, 3 for 3DBlast and 1 for 3DZernike).


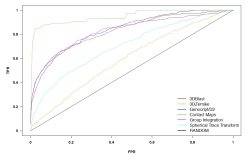
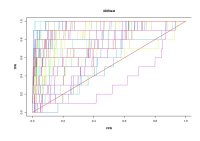
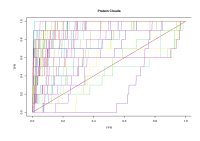
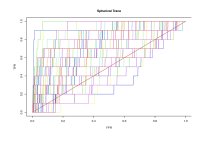
(0.2) ROC plots (Receiver Operating Characteristic):

jpg image
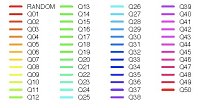
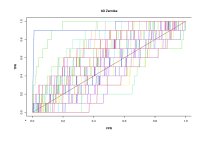
An aggregate ROC plot was calculated to summarize the overall performance of each method as a single ROC curve.

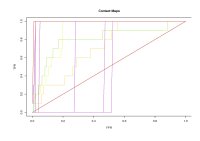
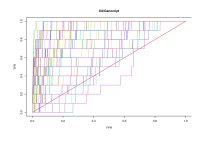
jpg image jpg image jpg image jpg image
Contact Maps GENOCRIPT 3D Blast
jpg image jpg image jpg image
Group Integration Spherical Trace Transform 3D Zernike


(1) Summary of our method (the GENOCRIPT / D2 method)

  We performed retrieval of the dataset of 1000 protein structures for structurally similar proteins of 50 query structures in the following three steps. First, the "CA" (or alpha-Carbon atom) traces of proteins were extracted from the supplied data files by considering the pattern of atom radii. Next, the D2 codes of the 1000 protein structures were computed by program "ProteinEncoder" and saved in a “.code” file (392 KB): target_SHREC2010.code. Also computed were the D2 codes of the 50 query structures: query_structure.code (Example). Then, retrieval of the dataset was carried out with program "ComSubstruct," which computes the length of the longest common subsequence of two D2 codes. For example, the top 100 D2 code-similar fragments are obtained by typing the following command:

      ComSubstruct -l -o1 -s -w1.1 -b100  query_structure.code  target_SHREC2010.code.

Because more than one fragment may correspond to a protein, the topmost fragment was chosen for each protein to obtain the ranked list of protein names. See below for more detail. Programs ProteinEncode and ComSubstruct are available from http://www.genocript.com.


(1.1) Extraction of the CA trace of a protein

  To identify the main chain fragments of N-CA-C, supplied data files are examined for the atom radius pattern of 1.70-2.00-1.74. Only the CA atoms of the N-CA-C fragments are considered in our method.


(1.2) D2 encoding of local protein structures

  We used a discrete differential geometrical technique, D2 encoding, for analysis of local protein structures, where the conformation of all five-CA fragments (i.e. fragments of five CA atoms) of a protein are encoded using a five-tetrahedron sequence [1]. First, the conformation of each five-CA fragment is represented by a folded sequence of five tetrahedrons. Next, the corresponding {0, 1}-valued sequence of length five, which are denoted as a base-32 number, are assigned to the center CA atom of the fragment. Then, we obtain a description of the conformation of a protein by arranging base-32 numbers in the order that the corresponding CA atoms appear in the CA trace. The base-32 number sequence is called the D2 code of a protein.


(1.3) Dataset search by ComSubStruct
 
 One of the simplest measures of sequence similarity is the length of the longest common subsequence (LCS). We used the length of the LCSs of two D2 codes to quantify the differences between two protein backbone conformations. The width of compare window was set to the product of "1.1" and the length of the shorter sequence using the "-w" option. The width of slide step was then the product of 0.1 and the length of the shorter sequence.


(1.4) Sorting structures

  Protein names are ranked based on the length of LCS. The length of proteins is used for tie-break purposes (the shorter, the better). The similarity scores are obtained by dividing the LCS-length by the protein-length. More precisely, the maximum value is (protein-length − 4) / protein-length.


REFERENCES

[1] N.Morikawa, Discrete differential geometry of tetrahedrons and encoding of local protein structure. ArXiv: 0710.4596 (2007).